Scalingo Autoscaler
The Scalingo Autoscaler is a feature that, once configured and enabled, allows the platform to automatically and dynamically adjust the number of containers of your application (horizontal scaling) depending on a performance metric while remaining within strict boundaries to prevent unforeseen costs.
Understanding the Autoscaler
An Autoscaler is linked to a process type, which means you can have multiple Autoscalers for the same application, as long as each one is set up for a different process type. Each Autoscaler can be set up differently.
When the configured metric deviates from the defined target, the Autoscaler automatically adjusts the number of containers of the process type, either up or down, to maintain the specified target.
The Autoscaler considers the following parameters to decide what to do and when to take action:
- Hysteresis: the Autoscaler decision is based on the “mean per minute” of the target metric. Two consecutive means over the target value are required for the Autoscaler to boot an additional container
- Aggregation: for CPU, RAM and swap metrics, the mean of all containers is used
- Cooldown (scale-out): after a scale-out event, the Autoscaler does not scale the application out again for at least one minute
- Cooldown (scale-in): after a scale-in event, the cooldown period is three minutes
- Step: by default, the Autoscaler adds only one container per decision round, ensuring a progressive and controlled adjustment. When the metric is RPM per container, the Autoscaler is able to add more than one container per decision round when required, allowing to scale much faster. The maximum number of containers still applies in such a case.
These rules are designed to prevent the application from scaling wildly. They make autoscaling effective at handling moderately increasing or decreasing metrics, but less effective at managing sudden, massive spikes. For such cases, and considering they are predictable, we usually advise to manually scale the application to an appropriate container formation.
Choosing a Metric
An Autoscaler can depend on 6 different metrics:
| Metric | Kind | Keyword |
|---|---|---|
| Requests Per Minute (RPM) per container | router |
rpm_per_container |
| Response Time | router |
p95_response_time |
| Number of 5xx errors | router |
5XX |
| CPU consumption | technical |
cpu |
| RAM consumption | technical |
memory |
| Swap consumption | technical |
swap |
RPM per container (recommended)
Requests Per Minute (RPM) per container is calculated as the total number of
requests received by your application divided by the number of running web
containers.
Usage
For applications with fluctuating traffic, this metric helps maintain a stable user experience by dynamically adding or removing containers to meet demand without overprovisioning.
Recommended Target
The target for RPM per container should be determined by performing small-scale load tests on your application. This helps understand how containers respond under different levels of traffic, ensuring the Autoscaler can scale effectively when needed.
Response Time
Response time measures the latency of your application in processing requests. The Autoscaler focuses on typical application performance by evaluating the 95th percentile of response times. This ensures that scaling decisions are not influenced by outlier spikes.
Usage
This metric is particularly relevant for applications where user satisfaction is tied to responsiveness. Monitoring response time ensures that the application scales to meet performance expectations.
Recommended Target
A good response time target depends on the criticality of your application’s speed.
Note that this metric might not always point to container saturation, it can also reflect external factors such as a database performance issue, a slow access to external online resources, or application-level bottlenecks.
5xx Errors
This metric monitors server-side errors, such as 500 Internal Server Errors, which indicate issues with your application or backend. The Autoscaler evaluates the frequency of 5xx errors per minute to determine whether scaling adjustments are needed.
Usage
This metric is particularly valuable for maintaining the reliability of your application under stress. For example, if the number of errors increases due to insufficient resources during peak traffic, scaling-out can stabilize the system. However, persistent errors may indicate deeper issues, such as bugs, database bottlenecks, or misconfigured dependencies, which should be addressed directly.
Recommended Target
The target threshold for 5xx errors per minute should be defined based on your application’s behavior and tolerance for errors. Applications with strict reliability requirements typically require a low threshold, while others may tolerate occasional errors during peak loads.
CPU Consumption
CPU consumption measures the average CPU usage across all containers. It reflects how computationally intensive your application workload is.
Usage
This metric is commonly used for compute-intensive applications. When CPU consumption frequently exceeds the target, the Autoscaler adds containers to distribute the load.
However, if high CPU usage persists despite autoscaling, it may indicate that your application requires more powerful containers to run properly. In such cases, switching to a larger plan (vertical scaling) can provide more CPU priority per container, thus enhancing the ability of your application to deal with resource-intensive scenarios.
Recommended target
The recommended target for CPU consumption is 90% of the total CPU capacity, ensuring your application uses resources efficiently without reaching saturation.
RAM Consumption
RAM consumption monitors the memory usage across all containers. Applications with high memory needs, such as those handling large datasets or caching, can benefit from autoscaling based on this metric.
Usage
This metric is particularly relevant for memory-bound applications. If your application frequently exhausts its RAM allocation, autoscaling will help distribute the workload to additional containers.
Recommended target
A target of 90% RAM usage is usually recommended, allowing a safety buffer to prevent out-of-memory errors and ensure smooth operations.
Swap Consumption
Swap consumption tracks the use of disk-based swap memory, which occurs when an application exceeds its allocated RAM. While swap provides additional capacity, excessive usage can significantly degrade performance.
Usage
Monitoring swap consumption helps prevent performance degradation. When swap usage exceeds the target, the Autoscaler adds containers to reduce the load on existing instances.
Recommended target
The recommended target for swap consumption is 10%. This ensures that your application uses RAM efficiently without relying heavily on slower disk-based swap.
Defining a Relevant Target
We provide a recommended value for each metric that you can use as the target. For router metrics, these values are computed based on the median of your application’s usage over the last 24 hours. This means they are solely based on historical data and do not include any future predictions.
Finding the best scaling target for your application is not an easy task. You should run benchmarks on your application to identify which metric is the bottleneck. A good approach is to scale the application down to 1 container and use a load testing tool (e.g. Vegeta) to stress test it.
We also usually advise to keep a small margin when defining a target. For example, if you notice your application stops responding after 100 RPM, setting the target to 80 RPM per container would be a reasonable choice. This ensures the platform can automatically scale out your application as needed, in time. For the most accurate results, these load tests should focus on the most resource-intensive endpoints of your application.
Limitations
- The minimum number of containers must be 2 to guarantee a minimal tolerance to fault. Allowing to scale-in to fewer than 2 containers would break the application high availability and create a risk of disruption in case of a failure. This would moreover go against our 99.96% Service Level Agreement.
- Router metrics are only available for containers running the
webprocess type. However, technical metrics are available for all types of process types.
Costs
Although the Scalingo Autoscaler itself is free, the additional containers started during a scale-out operation are billed like any other container (on the other hand, scaling-in can save costs).
Consequently, billing depends on the type of container you chose for your application (M is the default container size), on the maximum number of containers set in the Autoscaler configuration and on your application workload.
Creating an Autoscaler
Using the Dashboard
- From your web browser, open your application dashboard
- Click on the Resources tab
- Locate the Containers block
- In this block, locate the Scale button next to the process type for which you want to set up the Autoscaler
- Click the down arrow next to the Scale button
- From the dropdown menu, select Setup autoscaler
- The following popup window appears:
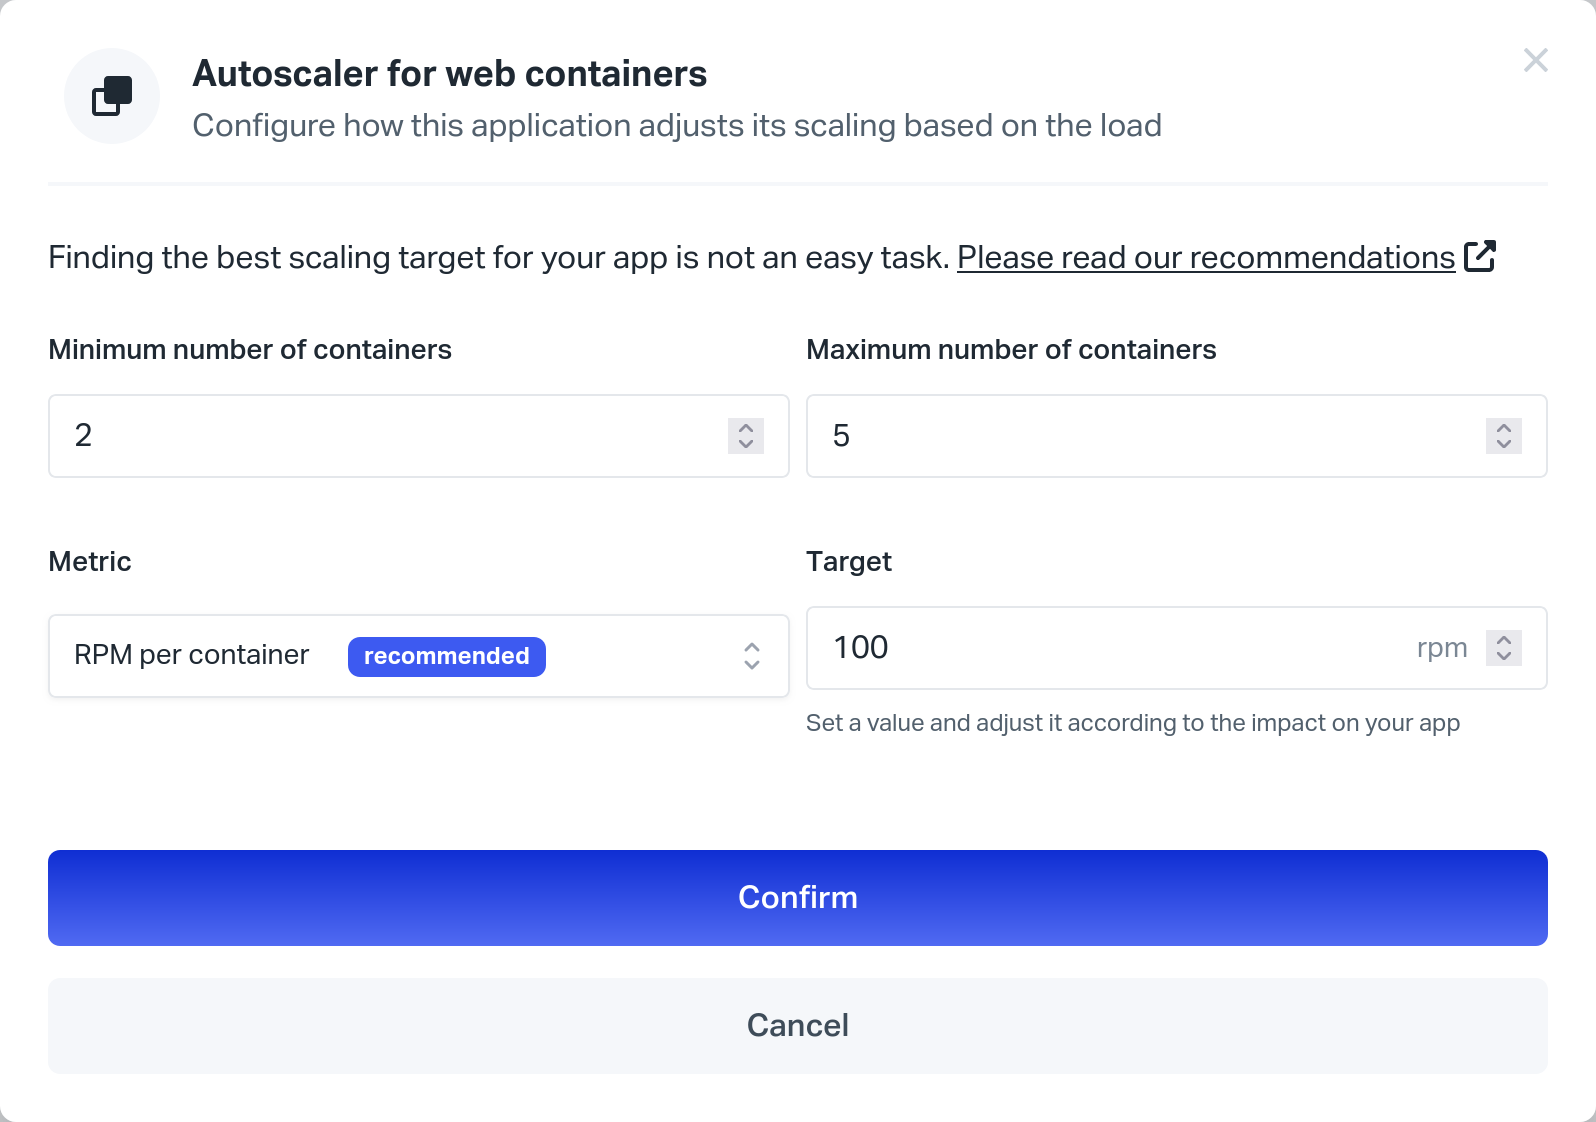
- In the popup window:
- Pick the minimum number of containers for this process type (minimum is 2)
- Pick the maximum number of containers for this process type
- Choose the metric to watch
- Choose a value above which the Autoscaler considers scaling-out
- Validate by clicking the Confirm button
- The Autoscaler is configured and enabled
Using the Command Line
- Make sure you have correctly set up the Scalingo command line tool
- From the command line, run the following command to set up the Autoscaler:
scalingo --app my-app autoscalers-add --container-type <process_type> \
    --metric <metric> --target <target> \
    --minimum-containers <min> --maximum-containers <max>
With:
-
process_type
Name of the process type to scale (e.g.web,clock,scheduler, …) -
metric
Name of the metric to watch.
Please refer to the Keyword column of the metrics table for available values. -
target
The metric value that serves as a boundary to trigger a scale operation -
min
Minimum number of containers to run -
max
Maximum number of containers to run
The output should look like this:
-----> Autoscaler created on my-app for web containers -
- The Autoscaler is configured and enabled.
Using the Terraform Provider
- Create the following
resourceblocks in your Terraform file to create the Autoscaler and attach it to your app:resource "scalingo_autoscaler" "web_autoscaler" { app = scalingo_app.my-app.id container_type = "web" min_containers = 2 max_containers = 10 metric = "rpm_per_container" target = 1000 }In this example, we create an Autoscaler that will start to scale-out the
webprocess type when the total number of requests received by the application divided by the number of runningwebcontainers exceeds 1000. It will start a maximum of 10 containers.
Please refer to the Keyword column of the metrics table for available values.
Enabling an Autoscaler
Enabling (or re-enabling) an Autoscaler allows you to put a previously disabled Autoscaler back in action, using the saved configuration.
When enabling an Autoscaler, and depending on the current state, the platform may decide to either scale-out (i.e. boot up additional containers) or scale-in (destroy excess containers) to fulfill its configuration.
Using the Dashboard
- From your web browser, open your application dashboard
- Click on the Resources tab
- Locate the Containers block
- In this block, locate the Scale button next to the process type for which you want to enable the Autoscaler
- Click the down arrow next to the Scale button
- From the dropdown menu, select Re-enable autoscaler
Using the Command Line
- Make sure you have correctly set up the Scalingo command line tool
- Make sure you have added and configured an Autoscaler
- From the command line, enable the Autoscaler:
scalingo --app my-app autoscalers-enable <process_type>Where
process_typeis the name of the process type for which you want to enable an Autoscaler (in most cases,web).The output should look like this:
-----> Autoscaler updated on my-app for web containers
Using the Terraform Provider
- Update the Autoscaler
resourcein your Terraform file like so:resource "scalingo_autoscaler" "web_autoscaler" { [...] disabled = false }
Disabling an Autoscaler
Disabling an Autoscaler allows you to put it out of action, while saving its configuration for later use. It can be re-enabled anytime.
Sometimes it can be useful to temporarily disable an Autoscaler to only rely on manual scaling, be it for testing purposes, to handle a planned peak such as the Christmas period for an e-commerce website, and so on… This feature allows you to put an Autoscaler aside for an undetermined amount of time, after which it can be re-enabled with the same configuration.
When disabling an Autoscaler, the platform does not scale-in. The number of running containers remains the same.
Using the Dashboard
- From your web browser, open your application dashboard
- Click on the Resources tab
- Locate the Containers block
- In this block, locate the Scale button next to the process type for which you want to disable the Autoscaler
- Click the down arrow next to the Scale button
- From the dropdown menu, select Disable autoscaler
Using the Command Line
- Make sure you have correctly set up the Scalingo command line tool
- Make sure you have added and configured an Autoscaler
- From the command line, disable the Autoscaler:
scalingo --app my-app autoscalers-disable <process_type>Where
process_typeis the name of the process type for which you want to disable the Autoscaler (in most cases,web).The output should look like this:
-----> Autoscaler updated on my-app for web containers
Using the Terraform Provider
- Update the Autoscaler
resourcein your Terraform file like so:resource "scalingo_autoscaler" "web_autoscaler" { [...] disabled = true }
Monitoring the Autoscaler
The following event is available to monitor Autoscaler executions:
| Event | Description |
|---|---|
app_scaled |
An autoscaling operation (scale-in and scale-out) has been triggered |
To learn more about events and notifiers, please visit the page dedicated to app notifiers.